
EPA’s FY2025 UST Performance Measures Are Out — Here’s the Story Behind the Tables
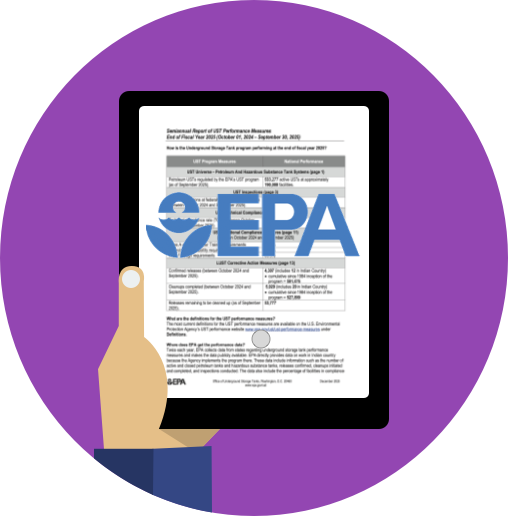
EPA’s Office of Underground Storage Tanks released the End-of-Year FY2025 Semiannual Report of UST Performance Measures, covering October 1, 2024 through September 30, 2025.
If you’re expecting a glossy narrative, this isn’t that. It’s mostly tables — but those tables are basically the national UST dashboard. And once you read them like a dashboard, FY2025 tells a pretty clear story: the program is doing a lot of work, we’re making measurable progress, and a few stubborn technical realities still drive outcomes everywhere.
Start with the scale (because it frames everything)
EPA reports a national universe of roughly 533,277 active USTs across about 190,000 facilities (as of September 2025).
And in FY2025, programs conducted 82,484 on-site inspections at federally regulated UST facilities. That level of inspection activity matters because these performance measures are grounded in what programs actually saw in the field.
The headline prevention metric: TCR at 62.9%
EPA’s headline prevention metric is the Technical Compliance Rate (TCR), and it finished FY2025 at 62.9% nationally.
The important nuance: TCR is an “all-of-the-above” measure across the core technical buckets (spill/overfill prevention, corrosion protection, and release detection). So it’s not “most items look okay.” It’s “the technical basics are all in place and compliant” for the facilities that were recently inspected.
The basics are strong — the full technical package is harder
EPA also reports three “supporting” compliance measures that most of us consider foundational program basics. Nationally, they remain comparatively high:
Class A/B operator training compliance: 88.6%
Financial responsibility compliance: 90.3%
Walkthrough requirements compliance: 83.3%
If you’ve ever felt like the paperwork fundamentals are often more consistent than the day-to-day technical discipline, the national pattern reflects that.
Cleanup: FY2025 crossed a meaningful threshold
On corrective action, FY2025 is a year worth noting:
Confirmed releases during FY2025: 4,307
Cleanups completed during FY2025: 5,920
Backlog (releases remaining to be cleaned up as of Sept. 2025): 53,777
The program completed more cleanups than it added confirmed releases in FY2025, while still carrying a very large remaining backlog.
Why state comparisons are useful — and why you have to use them carefully
EPA’s report notes these compliance measures reflect recently inspected facilities, and inspection strategies vary by state (random vs. targeted, different priorities, different rule frameworks). That means the tables are best used to spot patterns and focus areas — not as a simplistic “rankings list.”
Even inspection volume alone shows how different states’ program realities can be. FY2025 includes California at 13,383 inspections and Texas at 4,968, illustrating how uneven inspection scale and throughput can be across the country.
The “ends of the spectrum” show what’s possible — and where help is needed
On the high end, FY2025 shows:
Guam (GU): 98%
Connecticut (CT): 95%
Colorado (CO): 95%
Missouri (MO): 94%
Wyoming (WY): 94%
On the low end, the report shows:
Indiana (IN): 19%
Nevada (NV): 25%
Massachusetts (MA): 38%
Those differences are exactly why state program context matters — and why technical assistance, consistent operational practices, and inspection-driven follow-through remain such a big deal.
Cleanup production and backlog are concentrated
FY2025 also makes it obvious that the cleanup workload (and cleanup capacity) isn’t evenly distributed.
High annual cleanup completion volumes include:
Michigan (MI): 559
North Carolina (NC): 432
Ohio (OH): 416
Florida (FL): 410
And the backlog concentration in the table excerpt includes:
Florida (FL): 7,856
Michigan (MI): 7,812
New Jersey (NJ): 4,784
Illinois (IL): 4,601
That concentration matters for everyone — it affects where funding, contractor capacity, corrective action throughput, and program bandwidth tend to be stretched the most.
Bottom line
If you only take three things from FY2025:
The program is active and producing results — 82,484 inspections and 5,920 cleanups completed is real volume.
Technical compliance is moving, but still constrained — national TCR is 62.9%.
Cleanup progress is strong, but the remaining inventory is still huge — 53,777 releases remain to be cleaned up.